A strong chart settles the question
A chart is only one view of the selected period. Inspect individual trades, costs, data quality and periods when the rules behaved differently.

Backtesting
Replay a defined strategy and examine the assumptions behind the report.
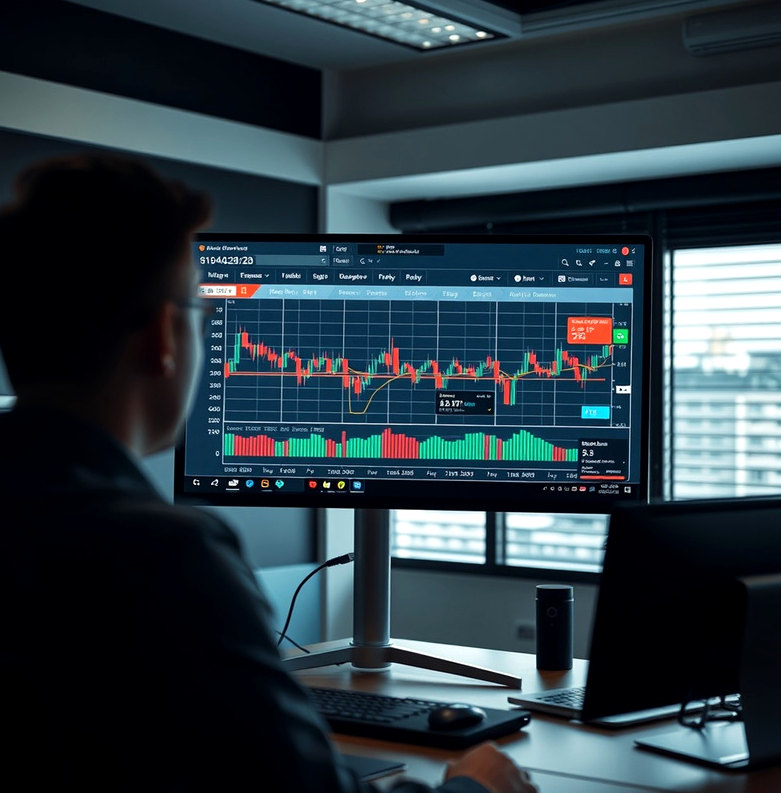
We configure a historical replay of your stated rules using the data available for the selected instruments and period. Setup commonly takes several working days once the rules and data scope are agreed. The deliverables are a test configuration, a trade-by-trade record and a report that identifies the tested dates and assumptions. Historical behaviour is not a forecast. Data gaps, transaction costs, spreads and live execution conditions can materially change what happens later.
A chart is only one view of the selected period. Inspect individual trades, costs, data quality and periods when the rules behaved differently.
Repeated adjustments can fit historical noise. Keep a record of changes and test whether the explanation for each new rule is coherent.
A replay uses modelling assumptions. Actual orders depend on broker responses, liquidity, spreads and the time at which instructions arrive.
Backtesting makes sense when you want to check whether a specific rule set behaved as expected on a clearly defined dataset. It is not a substitute for deciding whether to trade, and it cannot account for every future market condition. We recommend recording the data period, assumptions and each rule revision before comparing reports. That makes it easier to distinguish a genuine change in instructions from a difference caused by the test setup.

See the instruments, time period, rule version and available cost assumptions used for the replay.
Follow each signal through the recorded decision path, including occasions when a rule prevented an order.
Keep known data gaps and modelling constraints beside the report so comparisons have the right context.
Tell us which rule set and historical period you want to examine.
Ask about backtesting